ABOUT KELLOGG COMPANY
At Kellogg Company, we are driven to enrich and delight the world through foods and brands that matter. Kellogg is the world’s leading cereal company; second-largest producer of cookies and crackers; a leading producer of savory snacks; and a leading North American frozen foods company. Kellogg is a member of the World Business Council for Sustainable Development (WBCSD), part of the United Nations (UN) Global Compact, and is incorporating the UN Sustainable Development Goals (SDGs) in all that we do. Corporate Responsibility is part of our essence, instilled more than a century ago by our company’s founder W.K. Kellogg.
WHY IS KELLOGG COMPANY MEASURING FOOD LOSS AND WASTE (FLW)?
As a global food company, we believe we have a significant role to play in helping end hunger, achieve food security, improve nutrition, and promote sustainable agriculture (UN SDG 2). We will do our part to halve per capita global food waste at the retail and consumer level and to reduce food losses along the production and supply chains, including post-harvest losses, by 2030 (UN SDG 12.3).
To support these efforts, Kellogg was one of the first U.S.-based companies to join Champions 12.3 and to become a U.S. Food Loss and Waste 2030 Champion. Kellogg also co-leads the climate-smart agriculture project of the WBCSD and supports its Statement of Ambition, which includes making 50 percent more food available and strengthening the climate resilience of food communities. See our Food Waste Position Statement for more information.
During our first generation of sustainability commitments from 2005 to 2016, Kellogg significantly reduced waste (of all types) sent to landfill. In late 2016, we set a new 2020 goal to reduce total waste generated by our plants. Food waste represents the largest component of our waste stream and therefore the greatest opportunity for reduction. We estimate that reducing food waste within our facilities represents approximately $30 million in potential cost savings, based on the cost of raw materials, confirming the clear financial benefit of measuring (and reducing) food loss and waste.
We believe leftover or unwanted materials should be viewed as valuable assets rather than “waste” and sent to landfill as a last resort. Our ultimate goal is therefore to prevent food from being wasted in the first place and that any edible surplus food is donated to people in need. In cases where this is not appropriate, we send it to be used as animal feed. We follow the U.S. EPA Food Recovery Hierarchy, sending to landfill only as a last resort when there are no other viable options.
WHAT HAS BEEN YOUR EXPERIENCE WITH USING THE FLW STANDARD?
We have found the FLW Standard to be very helpful because it provides consistent language to use when talking about food waste and standard ways to measure and report. We used the FLW Standard to report our 2016 food waste by destination in our Corporate Responsibility Report (see page 25). This 2016 data will serve as the baseline against which we will continue to report.
The table below shows how we meet the requirements of the FLW Standard. Additional information about our food loss and waste reporting methodology and its alignment with the standard is provided below and shared on our website.
WHAT CHALLENGES IN MEASURING FOOD LOSS AND WASTE HAVE YOU ENCOUNTERED AND HOW DID YOU OVERCOME THEM?
In 2015, we used the draft FLW Standard to expand our tracking of measurable food waste to eight destinations outlined by the standard, including animal feed, biobased materials/biochemical processing, codigestion/anaerobic digestion, composting, controlled combustion (incineration), land application, landfill, and sewer/wastewater treatment.
Our first challenge was to identify which Kellogg facilities needed new ways to record food waste data in our internal tracking system and to split apart food waste that was previously being reported in a combined fashion. For example, a facility may have been reporting total waste incinerated for many years, but we were now asking it to report food waste incinerated separate from general waste incinerated.
Our second and biggest challenge has been estimating food waste sent to certain destinations, especially for sewer/wastewater treatment. We were able to use the concentration of our effluent at certain facilities using suspended solids, biological oxygen demand (BOD), and chemical oxygen demand (COD) to estimate the amount of food present in our effluent. We then extrapolated this to all of our global facilities based on effluent volumes and the types of products made at each location. Additional details are provided in the Methodology section.
WHAT ACTION HAS KELLOGG COMPANY TAKEN AS A RESULT OF MEASURING ITS FOOD LOSS AND WASTE?
We have been measuring our waste since 2005 and are working to meet our commitments to also reduce food waste in three important ways:
- FARMS: Working to eliminate post-harvest loss so that more of the food which is grown is consumed.
We are working with partners to develop and promote post-harvest loss reduction practices in major ingredients relevant to Kellogg by developing sustainable agriculture programs
with smallholder farmers in India, Bangladesh, South Africa, Thailand, Philippines, and other countries that promote and improve post-harvest loss reduction. Please see our Corporate Responsibility Report for additional details.
- MAKING OUR FOOD: Working to eliminate food waste in our processes, capturing it instead to feed people in need, and when that use is not appropriate, ensuring it is used for animal feed.
We are committed to reducing by 2020 total waste in our facilities by 15 percent per metric tonne of food produced. We set this target after achieving a 68 percent waste-to-landfill reduction from 2005 to 2016. In 2016, only approximately 1.5 percent of our food waste went to landfill, which is why we are focused on looking beyond “landfill diversion” to reduce in total the amount of food waste (as well as other materials). This moves our focus up the food recovery hierarchy toward elimination and reuse.
- REACHING OUT TO CONSUMERS: Working to standardize food date labels and educate consumers on whether food is safe to consume, as well as delivering tips and packaging innovation to help them reduce unnecessary food waste.
We are working with the industry to standardize food date labels that clearly communicate whether food is safe to consume, which helps consumers reduce their food waste. We are also increasing the use of resealable packaging in some of our cereals and granolas, snacks, and frozen foods to help further reduce consumer-level food waste.
- COMMUNITIES: Using our global signature cause platform Breakfasts for Better Days™ to assure our food also goes to help those in need due to either natural disasters or chronic hunger in communities around the world.
We are committed to fighting hunger and feeding potential through our global signature cause platform Breakfasts for Better Days™ with a goal to create 3 billion “Better Days” for people around the world by 2025. We are doing this in five ways: donating food to people in need, expanding kids’ breakfast programs, improving the livelihoods of farming families and communities, enabling our employees to be involved through volunteering events, and engaging citizens in the food security conversation, as well as other Breakfast for Better Days™ initiatives.
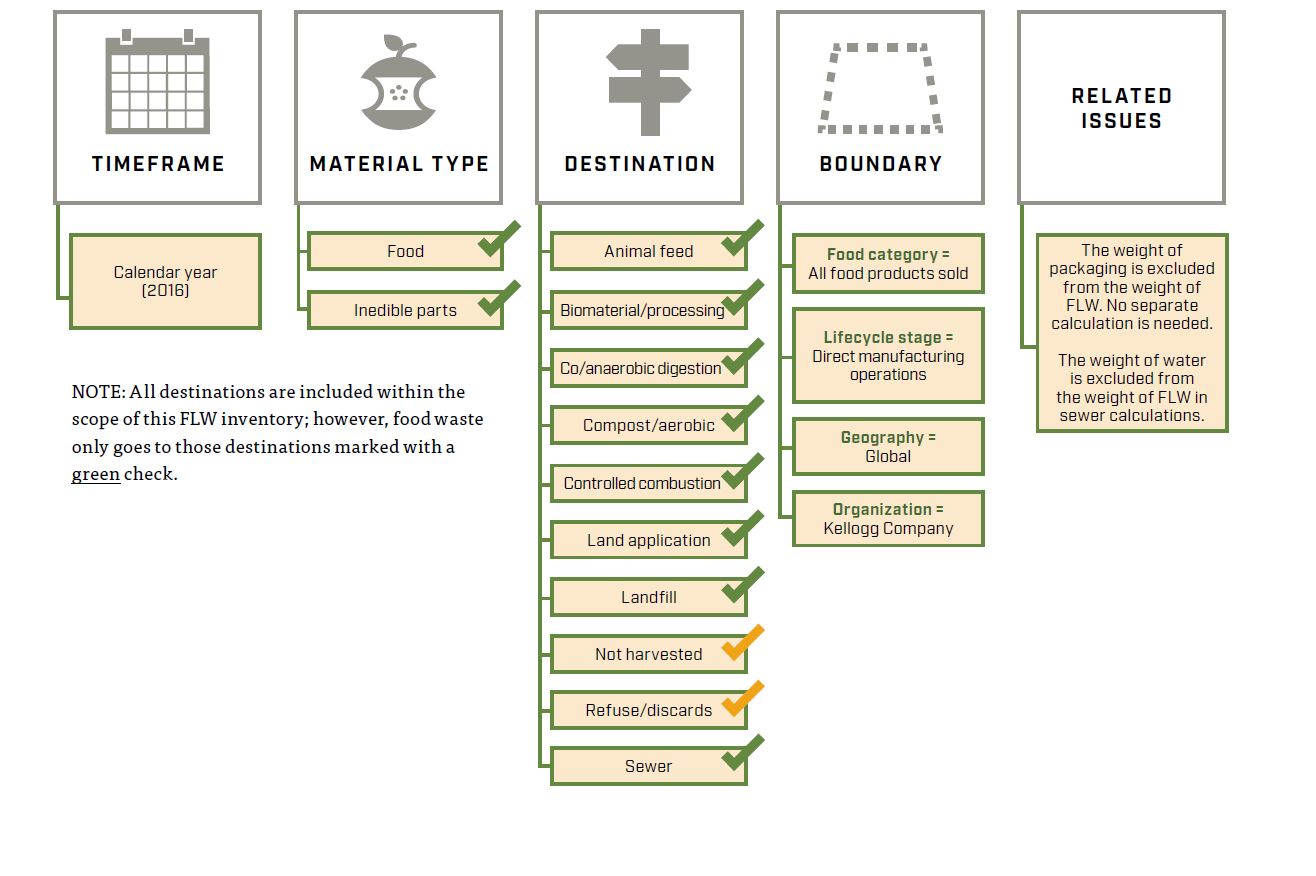
WHAT IS INCLUDED IN THE SCOPE OF THIS FLW INVENTORY?
The following figure visually represents the scope of Kellogg Company’s food waste inventory, using the FLW Standard. All destinations are included within the scope of this FLW inventory; however, food waste only goes to those destinations marked with a green check.
HOW DOES THIS INVENTORY MEET THE FLW STANDARD’S REQUIREMENTS?
The table below provides a summary of how this FLW inventory meets the eight reporting and accounting requirements contained in the FLW Standard.
| FLW STANDARD REQUIREMENTS & DESCRIPTION OF KELLOGG COMPANY’S FLW INVENTORY |
|---|
| (see www.FLWProtocol.org for details and guidance) |
1. Base FLW accounting and reporting on the principles of relevance, completeness, consistency, transparency, and accuracy
|
| 2. Account for and report the physical amount of FLW expressed as weight Food waste reported in metric tons |
| 3. Define and report on the scope of the FLW inventory (see FLW Standard for additional details) Timeframe: Calendar year Material type: Food and associated inedible parts (note: mass of inedible parts is very minimal) Destinations: All destinations fall under the definition of “food waste” for Kellogg Company, but food waste only goes to eight: animal feed, bio-based materials/biochemical processing, anaerobic digestion, compost/aerobic processes, controlled combustion (with energy recovery), land application, landfill, or sewer/wastewater treatment. Boundary:
Related issues: The weight of packaging is excluded from the weight of FLW. No separate calculation is needed. The weight of water is excluded from the weight of FLW in calculations to the sewer/wastewater treatment. |
| 4. Describe the quantification method(s) used. If existing studies or data are used, identify the source and scope Quantification methods include: direct weighing, records, waste composition analysis, volume, and proxy data; additional details below under “About the methodology.” |
| 5. If sampling and scaling of data are undertaken, describe the approach and calculation used, as well as the period of time over which sample data are collected (including starting and ending dates) See details below under “About the methodology.” |
| 6. Provide a qualitative description and/or quantitative assessment of the uncertainty around FLW inventory results See details below under “About the methodology.” |
| 7. If assurance of the FLW inventory is undertaken (which may include peer review, verification, validation, quality assurance, quality control, and audit), create an assurance statement Assurance not undertaken |
8. If tracking the amount of FLW and/or setting an FLW reduction target, select a base year, identify the scope of the target, and recalculate the base year FLW inventory when necessary
|
ABOUT THE METHODOLOGY
| DESTINATION | QUANTIFICATION METHODS USED | UNCERTAINTY Qualitative estimate based on a scale of 1 – 10, with 10 signifying very accurate data |
|---|---|---|
| Animal feed | Material: Food Quantification method: Records from waste management vendors, primarily derived from direct weighing at the destination Assumptions: Assumes that minimal amounts of water are added for disposal as dry feed is much preferred by vendors over wet | Uncertainty: 7 (Minimal verification of vendor data) |
| Bio-based materials/biochemical processing | Material: Food, including used food-grade oils Quantification method: Records from waste management vendors, primarily derived from direct weighing at the destination Assumptions: None | Uncertainty: 7 (Minimal verification of vendor data) |
| Co/anaerobic digestion | Material: Food and Sludge Quantification method: 1. Records from waste management vendors, primarily derived from direct weighing at the destination 2. Assumptions from sludge waste composition analysis Assumptions: Assumes 15% of sludge weight represents food waste and the remaining 85% is water. Assumption based on average of 2015–2016 sludge analysis from one cereal manufacturing location in the UK. During anaerobic/aerobic digestion, some food is consumed, but bacteria also generate waste and die; this is assumed to be negligible. | Uncertainty: 5 (Minimal verification of vendor data] [Assumptions scaled up from limited waste composition analysis) |
| Compost/aerobic processes | Material: Food Quantification method: Records from waste management vendors, primarily derived from direct weighing at the destination Assumptions: None | Uncertainty: 7 (Minimal verification of vendor data) |
| Controlled combustion | Material: Food and Sludge Quantification method: 1. Records from waste management vendors, primarily derived from direct weighing at the destination 2. Assumptions from sludge and general waste composition analysis Assumptions: 1. See sludge assumption above. 2. Assumes that 25% of general waste sent to incineration is food waste. Assumption based on 2009 waste analysis from two manufacturing locations (covering both cereal and snack production) in the UK. | Uncertainty: 5 (Minimal verification of vendor data] [Assumptions scaled up from limited waste composition analysis) |
| Land application | Material: Food and Sludge Quantification method: 1. Records from waste management vendors, primarily derived from direct weighing at the destination 2. Assumptions from sludge waste composition analysis Assumptions: 1. See sludge assumption above. | Uncertainty: 5 (Minimal verification of vendor data] [Assumptions scaled up from limited waste composition analysis) |
| Landfill | Material: Food and Sludge Quantification method: 1. Records from waste management vendors, primarily derived from direct weighing at the destination 2. Assumptions from sludge and general waste composition analysis Assumptions: 1. See sludge assumption above. 2. Assumes that 25% of general waste sent to landfill is food waste. Assumption based on 2009 waste analysis from two manufacturing locations (covering both cereal and snack production) in the UK. | Uncertainty: 5 (Minimal verification of vendor data] [Assumptions scaled up from limited waste composition analysis) |
| Sewer/wastewater treatment | Material: Food and Sludge Quantification method: 1. Sludge records from waste management vendors, primarily derived from direct weighing at the destination 2. Assumptions from sludge waste composition analysis 3. Calculations using sample total suspended solids (TSS) concentration records and global effluent volume data 4. Calculations using sample BOD and COD concentration records, proxy BOD/COD data for carbohydrates, and global effluent volumes Assumptions: 1. See sludge assumption above. 2. Sample concentration data (TSS, BOD, and COD) was selected to represent each type of manufacturing facility, including cereal, cookies, crackers, frozen foods, Pop Tarts, and Pringles. 3. Kellogg facilities complete various wastewater treatment techniques before discharging to various destinations. Treatment techniques include but are not limited to: no treatment, coarse screening, anaerobic digestion, and aerobic digestion. Included in this destination are various discharge destinations. These include but are not limited to: municipal wastewater treatment facilities, surface water, and water reuse for on-site irrigation. Sample effluent concentration data was selected to represent average treatment for each type of manufacturing. 4. Effluent data was not available for a small number of sites; therefore, existing effluent volume data was scaled up from facilities with similar types of manufacturing. 5. Assumes that all TSS is food waste. 6. BOD and COD calculations assume that all BOD/COD present in the effluent are a result of dissolved carbohydrates; therefore, proxy data for carbohydrates was used to calculate the mass of carbohydrates present in the effluent. We used the volume method, based on the raw milk example provided in the Guidance on FLW Quantification Methods, Supplement to the Food Loss and Waste Accounting and Reporting Standard, Version 1.0. | Uncertainty: 3 (Minimal verification of vendor data) (Assumptions scaled up from limited waste composition analysis) (Assumptions scaled up from limited TSS, BOD, and COD data) |
ABOUT THE AUTHORS
This case study was submitted by Erin Augustine (Kellogg Company) with input and review by Liz Goodwin, Brian Lipinski, JP Leous, and Kai Robertson (representatives of WRI), as well as FLW Protocol Steering Committee representative Dalma Smogyi of the World Business Council for Sustainable Development.
ABOUT THE FOOD LOSS AND WASTE PROTOCOL
The Food Loss & Waste Protocol (FLW Protocol)—a multistakeholder partnership—has developed the global Food Loss and Waste Accounting and Reporting Standard for quantifying food and/or associated inedible parts removed from the food supply chain—commonly referred to as “food loss and waste” (FLW). World Resources Institute (WRI) serves as the FLW Protocol’s secretariat.
For questions, please contact flwprotocol@wri.org.
Published: August 2017