Download PDF here »
ABOUT CRANSWICK PLC
Cranswick plc is a leading and innovative British supplier of premium, fresh, and added-value food products with annual revenues in excess of £1.2 billion. Our core market is the United Kingdom, where we produce a range of high quality, predominantly fresh products ranging from fresh pork, gourmet sausage, and bacon to premium cooked meats, charcuterie meats, and gourmet pastry. Recently we have started to produce fresh chicken and manage the whole supply chain from farm to fork.
We operate from seventeen state-of-the-art, highly efficient production facilities in the UK, with a workforce of over 10,000 people. Today, Cranswick is one of the largest food producers in Britain, but we’ve stayed true to our simple ethos—to create authentically made, sustainably produced British food, without compromise.
The focus of this study is the pastry division of the group. Cranswick Gourmet Pastry (CGP) creates a wide range of premium British pastries for a large UK retailer and operates one production facility with 400+ staff members.
WHY IS CRANSWICK PLC MEASURING FOOD LOSS AND WASTE?
At Cranswick, we understand that food waste is not only a financial cost to the business and significant environmental issue to tackle but also increasingly ethically unacceptable. With over 400 local people working at the CGP site, reducing food waste is becoming a key area of concern for our employees both at work and at home.
So by inspiring those at the “sharp” end of the business to do more with less, in 2017 we have transformed our approach to waste. While maintaining a zero waste to landfill measure as a key metric, our objective has expanded to a broader focus on waste reduction and reuse opportunities. We will achieve this through improved efficiencies and embedded behavioral change within our factory. Moreover, we are adopting a circular approach by instigating new reuse opportunities through closed-loop initiatives, such as offering our surplus ingredients for use in cooking workshops run by our local community café partner Next Steps.
By implementing a standardized reporting framework using the FLW Standard, we can better measure and manage our food waste through improved visibility and increased understanding as to where, how, and why waste has been generated. This empowers us to support achievement of Target 12.3 of the United Nations Sustainable Development Goals (SDGs) by 2030 across all of our business units; that is, to reduce our total food waste by 50 percent by 2030 from a 2016 baseline.
We made this commitment for the following reasons:
- Environmental: By reducing our largest waste stream—food waste—we can significantly reduce our environmental impact.
- Social: We have listened to our employees, customers, and community and understand that they care about us reducing food waste—not just within the work environment but throughout society for social good.
- Financial: Food waste results in significant costs to our business, which impacts the whole value chain.
WHAT HAS BEEN YOUR EXPERIENCE WITH USING THE FLW STANDARD?
Since we were already measuring our production food waste on a daily basis and documenting our methodology, we found translating the data into the FLW Standard a simple process. The Excel reporting template on the FLW Protocol website provided us with further structure to follow in our reporting process. Reporting our data in conformance with the FLW Standard has become a valuable management tool that allows us to report with clarity.
WHAT CHALLENGES IN MEASURING FOOD LOSS AND WASTE HAVE YOU ENCOUNTERED AND HOW DID YOU OVERCOME THEM?
One challenge was identifying food waste in a complex production process with multiple scenarios. We therefore conducted a detailed waste mapping analysis to understand exactly where food waste could be generated across every process and system scenario. This has allowed us to accurately capture, target, and track our food waste.
Another challenge we faced was getting our employees fully engaged on the target of a 50 percent food waste reduction and how this translated into their day-to-day actions within the factory. We are firm believers that people connect with people and not targets. The management team had to work hard to break the target down into expected behaviors by department, function, and job role to make it more tangible for employees. This means they can see where their actions can make a difference—and ultimately, buy into and sustain the benefits.
WHAT ACTION HAS CRANSWICK (CGP) TAKEN AS A RESULT OF MEASURING ITS FOOD LOSS AND WASTE?
Our food waste management project began with a detailed audit in 2016, which mapped the flow of waste throughout the business from inbound to outbound, highlighting waste hotspots, and key reduction opportunities. This 360-degree benchmarking study assessed current performance and improvement opportunities, including an internal and external stakeholder engagement review to identify barriers and drivers to accelerate performance.
Our stakeholder survey and leadership roundtable session brought the SDGs to life for our staff. “Zero Hunger” was selected as the most important to our employees, and “Responsible Consumption” was seen as an area where the business could have the greatest impact, with 73 percent of employees voting for food waste as their number one issue to tackle.
We believe that employee engagement and education on the subject of sustainability is a fundamental part of the strategy to reduce food waste. After completing our benchmarking study and stakeholder sessions, we decided to require that all staff adjust their view on “waste” and understand their role in minimizing waste. We have therefore committed to having 100 percent of our employees complete our bespoke “Journey of Food” e-Learning module by the second quarter of 2018, focused exclusively on food waste from the farm to our factory, and ultimately to the fork. We believe we will be the first food manufacturer to take this approach and invest in 100 percent of our employees at CGP being CPD-certified (Continuing Professional Development) in food waste management and minimization.
For the UK’s annual Recycle Week 2017, we carried out a four-day employee event focused on critical environmental issues, alongside launching a new community partnership with “Next Steps,” a local social enterprise that operates a social enterprise café in Malton, North Yorkshire. The inspiration for the partnership was born from stakeholder calls for increased community connections and measuring our food waste to identify our high-wastage items. Now, rather than sending surplus ingredients to anaerobic digestion as previously had been the case, the café will be collecting some of our surplus to make meals for people in need. The café produces over 55 meals a day on a regular basis and provides food for drop-in centers around the county.
As a business, we are now publicly committed to driving down food waste. In 2017 we became signatories of both the Grocer’s “Waste Not” campaign and the Champions 12.3 initiative, and have recently been recognized at the 2017 Waste2Zero Awards for Best Food Waste Prevention Project.
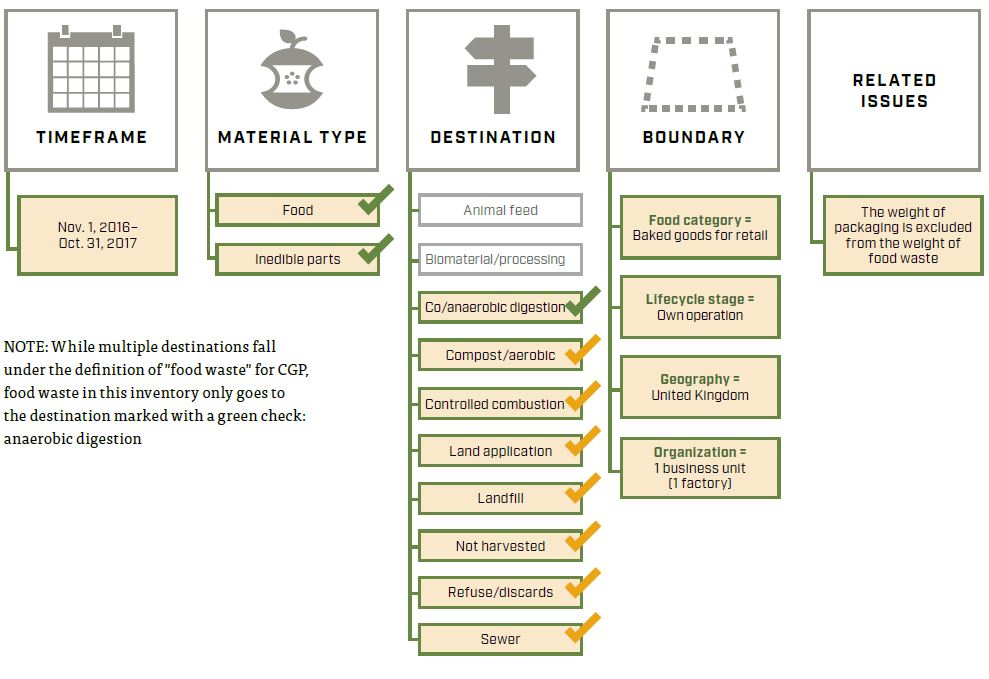
WHAT IS INCLUDED IN THE SCOPE OF THIS FLW INVENTORY?
The following figure visually represents the scope of Cranswick Gourmet Pastry’s food waste inventory using the FLW Standard. Multiple destinations fall under the definition of “food waste” for Cranswick, but food waste in this inventory only goes to the one marked with a green check: anaerobic digestion.
HOW DOES THIS INVENTORY MEET THE FLW STANDARD’S REQUIREMENTS?
The table below provides a summary of how this FLW inventory meets the eight reporting and accounting requirements contained in the FLW Standard.
| FLW STANDARD REQUIREMENTS & DESCRIPTION OF CRANSWICK GOURMET PASTRY'S FLW INVENTORY |
|---|
| (see www.FLWProtocol.org for details and guidance) |
1. Base FLW accounting and reporting on the principles of relevance, completeness, consistency, transparency, and accuracy
|
| 2. Account for and report the physical amount of FLW expressed as weight Food waste reported in tonnes |
| 3. Define and report on the scope of the FLW inventory (see FLW Standard for additional details) Timeframe: November 1, 2016–October 31, 2017 Material type: Food and associated inedible parts Destinations: While multiple destinations fall under the definition of “food waste” for CPG, food waste in this inventory only goes to anaerobic digestion Boundary:
Related issues: Packaging weight is excluded; no separate calculation is needed to separate the weight of packaging from the weight of the food waste since the product weights used to calculate the total weight do not include packaging |
| 4. Describe the quantification method(s) used. If existing studies or data are used, identify the source and scope Quantification methods include: direct weighing, records, and waste composition analysis |
| 5. If sampling and scaling of data are undertaken, describe the approach and calculation used, as well as the period of time over which sample data are collected (including starting and ending dates) N/A |
| 6. Provide a qualitative description and/or quantitative assessment of the uncertainty around FLW inventory results The degree of uncertainty varies depending on the source of the information and on the stages in the factory; ongoing projects to remove the risk of human error within the process |
| 7. If assurance of the FLW inventory is undertaken (which may include peer review, verification, validation, quality assurance, quality control, and audit), create an assurance statement N/A |
| 8. If tracking the amount of FLW and/or setting an FLW reduction target, select a base year, identify the scope of the target, and recalculate the base year FLW inventory when necessary
|
ABOUT THE AUTHORS
This case study was submitted by Andy Mayer, Cranswick plc, with input and review by Liz Goodwin, Brian Lipinski, Emily Neagle, and Kai Robertson (representatives of WRI), as well as FLW Protocol Steering Committee representative Richard Swannell (WRAP).
ABOUT THE FOOD LOSS AND WASTE PROTOCOL
The Food Loss & Waste Protocol (FLW Protocol)—a multistakeholder partnership—has developed the global Food Loss and Waste Accounting and Reporting Standard for quantifying food and/or associated inedible parts removed from the food supply chain—commonly referred to as “food loss and waste” (FLW). World Resources Institute (WRI) serves as the FLW Protocol’s secretariat.
For questions, please contact flwprotocol@wri.org.
Published: April 2018